

While indicators of capacity shortages may be obvious (we do not have any space to put away pallets), others can be difficult to detect (the pick line is too short to place each SKU in its ideal slot size).
When a distribution centre operates beyond capacity, it pays clear and hidden operating penalties. By tracking capacity related KPIs, you can identify these penalties and act rapidly to address them.
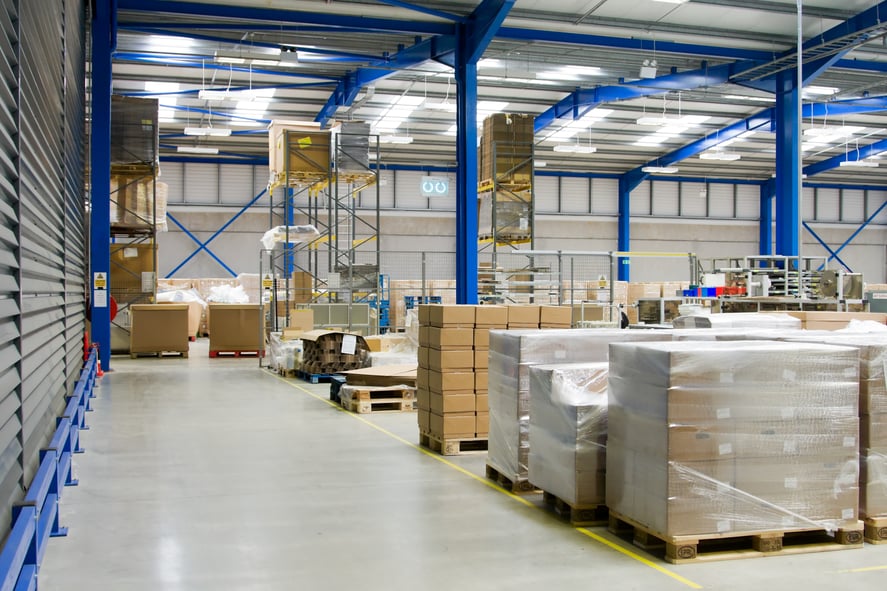
Here are some KPIs related to capacity:
1. SKU-to-slot size assignments
Measurement: Replenishment instances per week per SKU
General Rule: Re-slot SKUs generating more than one replenishment task per day (fast movers) or per week (medium/slow movers)
2. Storage capacity utilization
Measurement: Pallets on hand vs. pallet positions and cubic feet on hand vs. net cubic feet capacity
General Rule: Keep 15% open reserve pallet spaces to facilitate putaway and replenishment (the amount is a function of inventory turns)
3. Pick slot utilization
Measurement: SKUs vs. pick slots
General Rule: Keep 10% open pick slots to easily introduce new SKUs or provide a buffer during peak periods
4. Dock-to-stock time
Measurement: Delay between receipt and putaway times
General Rule: Reduce over time
5. Damages & mispicks
Measurement: Rate as a percentage of units picked
General Rule: Minimize over time
6. Throughput productivity
Measurement: Units per hour, using the handling unit as the proper unit of measure
General Rule: Improve over time
Any KPI trending in the wrong direction indicates a capacity problem. Before hunting for a bigger, taller building, you may be able to resolve capacity limits by improving space configuration within your existing DC.
Interested in learning more about maximizing your DC capacity? Download LIDD’s ebook Distribution Centre Optimization.